
Hidden and Interesting odds of Machine learning
Odds of Machine learning


Yogesh Agrawal
Hello all, today I came with some of the funny and hidden topics and terminology which are widely used in our day to day work but it is less popular compare to other buzz words in statistics. I mean these topics also deserve some respect 💩, some time when I sit back and think about these kind of things is really excites me and motivate me to learn little more deep about these facts. Let’s start without delaying further.
1. Averages -
Well this is very easy thing right ? you would be thinking why this guys is telling me about Average. Any 3rd or 4th class student will tell you about average of the given numbers right ? i.e. average (mean ) is given as total sum of given number divided by total number given
But wait lets think for a second, if I would ask for what is mean of that number ? you would probably say Mean or Average is same that is Mean = Average. but it is the half truth ‘Average’ is just a term, do not misinterpret with Mean. Mean, Median and Mode all are termed as different kind of averages. For more info follow this book chapter 2. So, when you say average give special attention to what kind of average you are referring to.
2. Normal distribution and Standard Normal distribution -
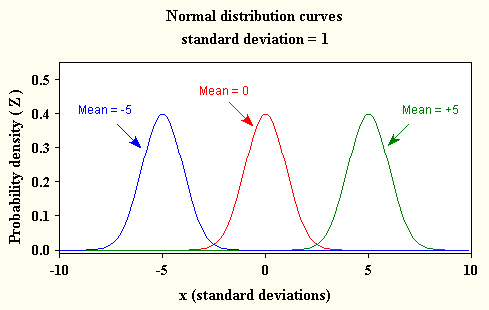
Generally when we read in articles or books its always written data is normally distributed, it follows normality but very less about standard normal distribution. when we say normal distribution, people assumes bell shape curved graph.
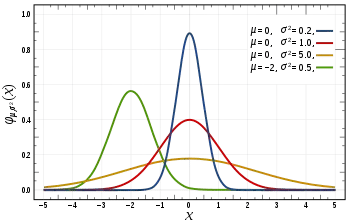
Yes, exactly this above picture. But if you notice Mean and Variance both are not consistent even though all are in normal distribution. don’t you think we are missing some thing or something odd about this ? lets say if a class of 50 students and all have different attributes and measured under same scale by considering that all follows normality ?
Again that not exactly happens and that’s where we came across term ‘Standard Normal distribution’. it says if the data follows normality it should have mean(/u) = 0 and variance ( sigma) is 1. if data follows that condition then only data have standard normality or true normality.
Now question comes to my mind if my data does not follow above condition so it means it does not follow true normality. No, Again that’s not completely true and for that our scientist have found out ways and discovered a term called Standard score.
3. Standard Score-
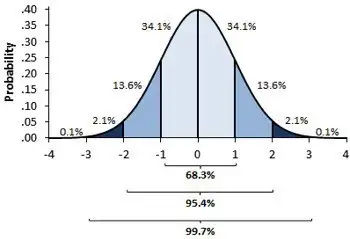
Standard score is also known as ‘Z-score’ that basically tells that our normally distributed data is how much deviation(+ve or -ve ) away from a true normal distribution or standard normal distribution. if you notice above ‘ standard graph’ 34% of area comes under Z-score of 1 and same 68% of area comes under Z-score of 2. so lets assume your data graph comes between 0 and 1 which basically means that much standard score shift required to bring it back to original 0 scale so that it follows standard distribution.
Ex: like we discussed students attributes, suppose 150 cm is standard student height and one student has approx. 145 cm height then how much more it required in percentage of any scale you take to reach to 150 cm. once you calculate the Z-score check the value in Z-table ( already derived ) can get value and use in different calculation.
Z-score or standard score have range of max -3 to +3 because it almost covers 99.99% area.
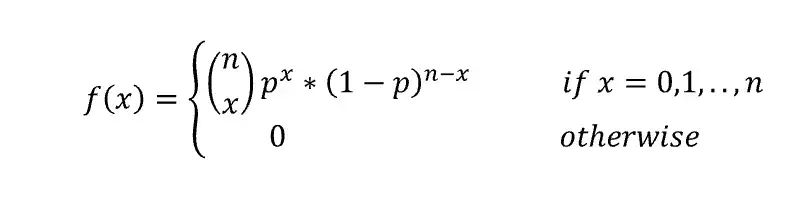
4. Bernoulli’s and Binomial distribution-
This is very common and widely used distribution technique but many fails to correctly use both of these distribution.
Bernoulli’s and binomial both distribution comes under discrete probability and follow PMF ( probability mass function). Both distribution used for binary and independent events.
Ex : Roll a dice twice or pick two cards from the deck of cards etc.
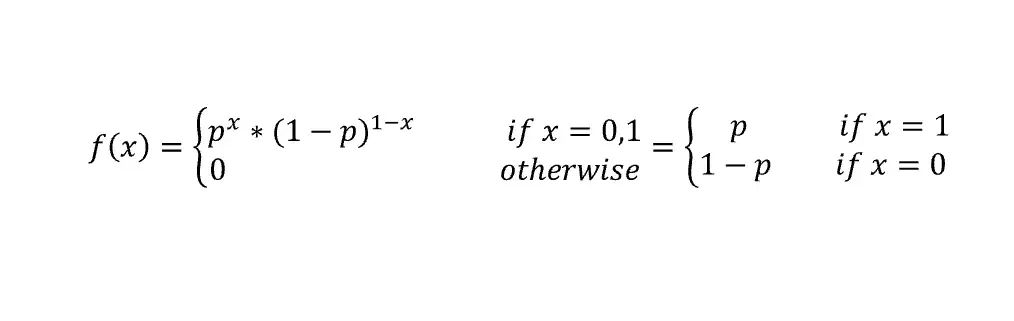
The Bernoulli distribution is the discrete probability distribution of a random variable which takes a binary output: 1 with probability p, and 0 with probability (1-p). so in each case either you get success or failure.
but wait there is catch if we have to do same thing again and again then, do we have to do same calculation random number of times ? I think that would not be possible in real world.
Wait, There comes our savior ‘Binomial ’, so binomial says ‘’This distribution describes the behavior of the outputs of n random experiments, each having a Bernoulli distribution with probability p.’’
If you have to toss a coin again and again many times & figure out probability, in that case no need to go ahead with Bernoulli instead use binomial.
So basically I mean to say both are same just use cases are different. And when less number of trial go with Bernoulli other wise binomial. For more on this topic a beautiful article refer this.
5. Log and Exponential function-
Logarithms and exponential function are very crucial and widely used function in stats and machine learning.
Log function -

Log is a monolithic function which basically means it is very slow change relative to nature. Remember rabbit and tortoise race. Log is a tortoise which is slowly increasing or decreasing ( in case of inverse).
Log has many type which means different bases, so if we say base 2 which means it will take power of 2 to RHS value. similarly for log base 10. There is 1 more special kind which is base of e or natural log. it is mostly used in stats and predefined calculations.
As Log has property of slowness it basically reduce the term like -multiplication to addition , so if we have
x1 * x2 * x3 ….. Xn it would be difficult to calculate, rather than apply log on then it will look like Log(x1*x2*x3….Xn) = log(x1)+log(x2)+log(x3)….log(xn).
so it will convert in addition which is lot easier compare to multiplication. same can apply for division and power rule. Log is essentially use in Machine learning for optimization ( Remember Linear regression loss function ) or wherever we use gradient, we go ahead with Log.
6. Parametric and Non- Parametric model -
In machine learning , we deal with many algorithms to solve any problem such as Linear Regression, Logistic Regression or Random Forest. But wait if client ask to interpret the model results, have we thought how many models are interpretable ( I meant properly explainable )
There we come across importance of Parametric & Non-Parametric model. Parametric models are those that can be explained mathematically and you can see how each & every component behave with data.
Ex: In Linear Regression we form a equation like : Y = mx + c. where m represent slope ( Beta coefficient in ML terminology ) and based on this ‘m’ value we determine whether ‘x’ regressor is +ve affecting or -ve. So these model is parametric model where we get a mathematical equation.
Non-Parametric Model -
These are black-box model and do not reveal any mathematical equation. For example random forest is a rule based approach where decision made based on Yes or No method. Also, these model we can’t explain in real world ( through we have some approach like lime, shap etc. ) but all those are also approximation method and not actual
Here we come to the end of this blog, though this not complete yet and I will continuously update the same as an when I get some time. Please do bookmark this for future changes. Also, If you have something that I can add, please do let me know in comment, I will be happy to update in the same.
Have a very happy new year and cheers :)
Upvote
Yogesh Agrawal

Related Articles