
Introductory Primer to Bayesian Statistics
A mathematical introduction to the world of Bayesian Statistics


reo neo
In 1748, philosopher David Hume wrote the essay “On Miracles” arguing that incredulous and miraculous stories written in the past should not be believed because they went against the law of nature. 15 years later, a posthumous paper by Reverend Thomas Bayes raised an even more important question, “How much evidence do we need to support any claim?”
While his paper did have a theological purpose, it also has many mathematical implications that are arguably even more relevant today.
250 years later, his simple formula is still widely relevant and has even created a whole new branch of statistics. Not only is it a fundamental concept in any introductory probability class, but also powers many important algorithms and technologies that we have today.
Mathematical Intuition of Bayes’ Formula
Let’s look at Bayes Formula in the context of a simple parameter estimation problem. We collect some data x and we are certain that the data is generated based on some parameter θ.

In this case, probability is not a rate of occurrence but a degree of certainty. If the probability is 0, we are certain that the claim is false, while if the probability is 1, we are completely certain that the claim is true.
With this change in perspective, P(x|θ) is our certainty in the value of θ. Note that this is a probability conditioned on x. As such the posterior essentially states “given that we have collected data x, our certainty of θ is as such”
This posterior consists of 3 parts
- P(x|θ) — Likelihood: Probability of observing the evidence given the current model. This model can be seen as setting certain assumptions on the data. Eg. If we assume the rate of flash floods to be Poisson Distributed with a rate parameter λ the likelihood will be based on the probability mass function of the Poisson distribution.
- P(θ) — Prior: The initial distribution of our parameter. Using the earlier Poisson example, we can approximate the rate parameter λ to be following a uniform distribution from 1 to 3
- P(X) — Model Evidence: Probability of observing the evidence for all parameters. In most cases, its main purpose is to be a normalizing constant for the posterior. A valid probability distribution has to sum up to 1 and the normalizing constant helps to ensure that.
The usefulness of this formula is that we can feed our posterior to be the new prior as additional evidence is being brought in. This creates an iterative procedure where we slowly adapt our posterior to the evidence to evaluate our degree of certainty in a certain claim.
Since P(X) is a normalizing constant, in most cases, we can express the posterior as a simpler proportionality equation. This allows us to rewrite Bayes formula as such:

Now that we understand Bayes Formula, let’s revisit frequentist linear regression and see how it's different from a Bayesian approach.
Frequentist Linear Regression
In vanilla (simple) linear regression we have a model which can be formulated as such:


Linear Regression Model
Our target variable Y can be decomposed into the deterministic component β x +α and a stochastic component ϵ which is modeled as random noise.
From this, we can also obtain the conditional distribution for Y which is P(Y|X,β) ~ N(β x +α, ϵ)
In frequentist statistics, we are only concerned with the likelihood. In this case where we have labelled data, it’s slightly different as we are concerned with the conditional likelihood P(Y|X,β)
Since the likelihood is conditioned on X and β, this conditional likelihood is the probability density function of the normal distribution.


Probability Distribution of Conditional Likelihood
As usual, we convert this to the log-likelihood which is easier to optimize.


Conditional Log-likelihood
Now that we have our log-likelihood function, we can perform the optimization and find the β which will maximize this likelihood function. Notice that the first 2 terms are independent of β and can be omitted. Similarly, since 1/2σ² is a constant, it will not affect the optimization and can be omitted. What is left is the optimization objective below.

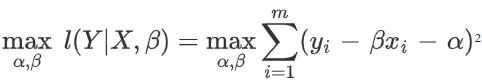
If this objective looks familiar, it's because it is the least-squares objective that we are all very familiar with.
Performing least-squares on a linear regression dataset is doing Maximum Likelihood Estimation. Essentially this gives us a statistical interpretation of what linear regression is doing!
Bayesian Linear Regression
In frequentist statistics, we believe there to be a “true value” or “correct answer” for each unknown parameter. Maximum likelihood estimation is then used to obtain optimum estimates for these parameters given the observations made. In Bayesian statistics, the parameter itself is a random variable and we try to obtain the distribution of this random variable from the observations.

General Linear Regression equation
For Bayesian Regression, we will show the general case, starting from the equation Y = Xβ. For a regression problem with k features and n data points, β is a k+1 size vector (includes intercept) and X is a n × k+1 matrix.
However, there is a key difference between this and the previous case. Our parameter β is no longer a point estimate but has its own distribution. We first initialize it as the prior distribution or P(θ). To simplify our calculations we shall start with a normal distribution as our prior with mean vector μ₀ and our covariance matrix will be the identity matrix I.
From this, we can now solve for the posterior distribution. This is done by applying Bayes’ Formula for all the variables in the model to solve for the posterior.
Solving for Posterior
Thanks to our earlier assumptions, we can derive an analytical solution to this particular problem. Recall earlier that we are able to express our posterior as a proportionality equation that combines the prior and likelihood together.
Our likelihood and priors are both multivariate normal distributions and can be expressed as such


Distributions for Likelihood and Prior
For now, let’s focus on the exponential term combine the likelihood and prior.

We can remove terms that do not contain β as they are constants and can be absorbed into the normalizing constant term

From here we see that the posterior can be expressed as a general form of
C exp(-Q(β)) where Q(β) is a quadratic polynomial. This means that the posterior has to be a normal distribution. Now our goal is to manipulate the exponential part to the form (β — μₙ)ᵀ Σ ⁻¹(β — μₙ).
The quadratic portion can be factorized into βᵀ(XᵀX+I)β. This gives us Σ which has to be [βᵀ(XᵀX+I)β]⁻¹
The next part is -2μₙᵀΣ⁻¹β. This corresponds to 2(YᵀX + μ₀)β. With some manipulation and matching, we can also derive an expression for this.
Note: Using this factorization there will be a term μₙᵀΣ⁻¹μₙ but it can be removed as it is not a function of β
This gives us the final PDF for our posterior

where μₙ and Σ are the mean vector and covariance matrix respectively.
Interestingly, if we set our initial mean μ₀ to the 0 vector, we get a very familiar solution. The value of μₙ will be (XᵀX + I)⁻¹XᵀY which is the ridge regression solution if we added a regularization term. What this means is that ridge regression can be viewed from a Bayesian perspective as having a prior centered at 0!
Bayesian statistics tells us how to adjust our prior beliefs when presented with evidence. If our observations are not normally distributed or we want different starting parameters we can do that freely. Bayesian statistics gives us a way to compute (or at least approximate) a distribution for our parameters θ
Why Bayesian Learning?
- Incorporate Prior Information
Priors are very useful as it helps us to guide our model to a different objective based on some knowledge that we have that is outside the data. Bayesian statistics gives us a mathematical way of incorporating that information. In fact, popular regularization techniques like L2-Weight penalization can be seen from a Bayesian lens as having a specific type of prior.
2. Obtain a Distribution of Parameter values
One huge strength of Bayesian techniques is that these models return a distribution of parameter values. These parameter values can then be used to calculate confidence intervals for predictions. In settings where wrong predictions can have huge consequences, having these confidence intervals can help decision-makers better estimate the probability of incorrect predictions.
3. Insufficient data
While MLE is shown to be the best estimator given a sufficiently large number of samples, in many cases, we do not have enough data points.
One possibility is that the data is scarce due to the difficulty of obtaining samples. Another more common possibility is that the data is high-dimensional. As the number of dimensions increases, the number of samples we require increases exponentially causing our MLE estimator to not be sufficiently accurate.
Having a point estimate for the parameter collapses all of the probability distribution into a single point which can lead to the model being very confident about an incorrect prediction.
Using a Bayesian approach helps the model to be less confident when observing data points that are more foreign and reduce the probability of incorrect predictions being generated with high confidence.
However, Bayesian techniques do have a big weakness which is that they can be hard to compute. In many cases, obtaining $P(X)$ is mathematically intractable and we cannot solve for the posterior analytically. In these cases, Bayesian Inference is done by approximating the posterior. In the next blog post, I will be delving into these methods and show how they work.
If you enjoyed the article do follow me on Medium!
https://reoneo.medium.com/
Connect on LinkedIn: https://www.linkedin.com/in/reo-neo/
Reference
Goodfellow, I., Bengio, Y. and Courville, A., 2016. Deep learning. Cambridge (EE. UU.): MIT Press, pp. Section 5.6 Bayesian Statistics.
Pearl, Judea, and Dana Mackenzie. The Book of Why. Penguin Books, 2019.
Upvote
reo neo

Related Articles